Populating an Analytics dashboard with site-level Adobe Analytics data
Once you set up an Adobe Analytics site-level report, you must configure a Report widget on the dashboard that displays its metrics. One Report widget houses one site report and its metrics; therefore, to display metrics from both a device report and a site report, for example, you must make two Report widgets. For details on how to set up the prerequisite Adobe Analytics reports, see the topics below:
- Setting up an Adobe Analytics device report
- Setting up an Adobe Analytics referral report
- Setting up an Adobe Analytics site calculated report
- Setting up an Adobe Analytics site report
The procedure in this topic assumes that you are creating a dashboard from scratch, to which you then build Report widgets to display Adobe Analytics; however, you may also access an existing one-off or shared dashboard and add Report widgets to it.
To populate an Analytics dashboard with site-level Adobe Analytics data:
- Click > Admin > Dashboards.
- Under Name, give the dashboard a name (for example,
Adobe Analytics Dashboard). This is an internal name used to help identify this dashboard among others in the Dashboards area. - Under Main Tab Name, override the default main tab name (
Main) to something that indicates what this dashboard displays (for example,Analytics). - Under Main Tab Columns, under Widgets, click , then select Report Widget.
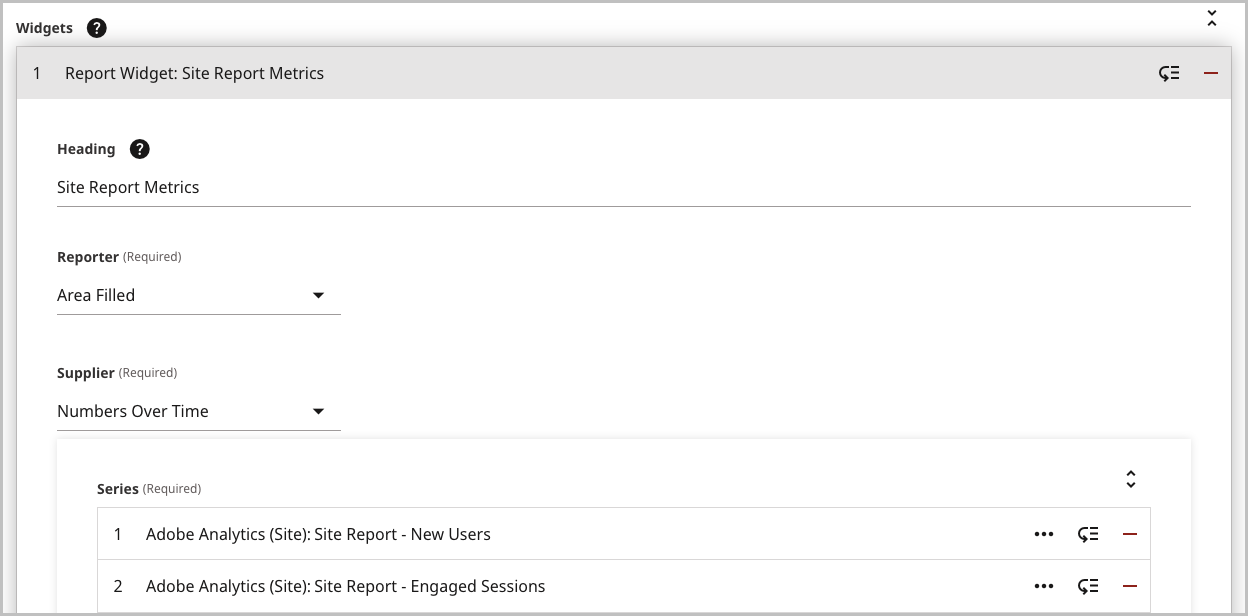
- In the Heading field, give the widget a name (for example,
Site Report Metrics). - In the Reporter field, select Area Filled.
- In the Supplier field, select Numbers Over Time.
- In the Series field, select Adobe Analytics (Site).
- Under Report Suite, select the report suite in which you configured an Adobe Analytics site-level report. For details, see Importing an Adobe Analytics report suite.
- Under Report, select the specific report whose metrics you want to display in the widget.
- Under Metric, select the specific metric you want to display in the widget. Your settings should look similar to the following image.


To add additional metrics, click and then repeat steps 9–11; however, to save time, refer to the tip below.
TipTo save time, in the Series object you just configured, click > Copy to produce a copy, then update the selection in the copy's Metric field.- Under Period, select the time period to be displayed in the widget by default (for example, Set Month).
- Repeat steps 1–13 to add additional Report widgets that display other reports and their metrics. See the image below for an example of a configured Report widget.


- Click Save.